|
|
 |

Data Loggers
Based upon the way data is recorded and stored, there are two types of standalone data loggers. One type stores the data in memory to be retrieved at a later time; the other type automatically records the data on paper for immediate viewing and analysis. Many designs combine these two functions, with one or the other of primary importance
The discussion here is confined to various types of standalone units. In addition, there is a wide variety of software packages that can be loaded into PCs, DCSs, or other computer-based devices to provide excellent data-logging and digital data storage capabilities.
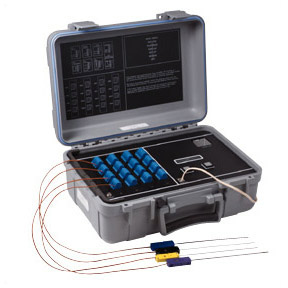 |
This portable data logger handles up to 16 channels and can
download data to Windows-based programs for later analysis. |
Note, too, that hybrid recorders, as mentioned earlier, serve many of the functions formerly reserved for a separate data logger. Conversely, modern data loggers also can provide visual displays and digital read-outs. They also can perform complex mathematical operations on incoming data.
Functional highlights of a typical programmable, multi-functional data logger include:
Automatic measurement, digital display, recording (storage), and printing of data from a variety of inputs (e.g, thermocouples of different types and voltage sources).
Wall, panel, and bench-top configurations.
Programmable parameters including date and time, print interval, contents and format of print-out, configuration of each channel, high and low alarms, and much more.
Two-way communication via RS-232 serial port-for programming inputs and data outputs via a remote PC or other system.
Optional alarm boards with high and low relays for each channel.
Built-in thermal printer with external trigger control.
Data cache with buffer.
Graphical software for an associated PC.
Not all standalone units, of course, offer all such features. Some are smaller and more portable, using built-in memory to store data for later review. These usually include an RS-232 serial port for data download and a digital display.
Some models are battery-operated for easy portability in field applications. One variation is a self-contained unit that can, for example, profile temperatures as it passes through an in-line bake oven.
| 20 Questions in Recorder Selection |
| |
Given the wide variety of instruments for recording or logging acquired data, the prospective user needs to review the key factors involved in making a suitable selection. To help, here are some key questions and basic points to consider: |
| 1) |
How many inputs are to be recorded or logged? These are often called channels, points, or records. |
| 2) |
What types of inputs are involved? Voltages, T/C or RTD, 4-20 mA. |
| 3) |
Do different input types need to be handled by the same unit? |
| 4) |
What type of recording or logging is required-continuous single-point or multi-point? And if the latter, what minimum scan cycle is required? |
| 5) |
What degree of accuracy is required? Accuracy may be defined as the closeness to the actual signal that the measured value or trend position takes-stated in either a plus/minus percentage of full scale or percentage of reading. |
| 6) |
Is a communication interface required to transmit measured data to a host computer? Set up the instrument remotely? Connect to an external printer? |
| 7) |
Is the instrument to be mounted bench-top or in a panel? |
| 8) |
What type of instrument power is available? |
| 9) |
Is log-type recording desired instead of or in addition to continuous trend recording? |
| 10) |
Is color differentiation desirable for multiple trend lines? |
| 11) |
If the instrument is to perform alarm functions, how many alarm setpoints are needed per channel? What types of alarms are desired-e.g. threshold, rate, or delta? Are relays contacts required to handle external alarm outputs? If so, how many? |
| 12) |
What, if any, signal processing is required? These may include linear scaling (conversion to engineering units), thermocouple characterization, difference calculation, square root calculation (as for an orifice flowmeter). |
| 13) |
Are any higher-level math functions required? These may include absolute value, logarithm, exponential, maximum, minimum, time average, group average, summation, standard deviation, and integration functions. |
| 14) |
For conventional, paper-based recorders, what writing method is preferable? Capillary ink? Disposable felt-tip ink cartridge? Dot printing, using an ink ribbon cassette or pressure sensitive paper? Thermal moving head or stationary linear array? Rotating ink wheel? |
| 15) |
If a strip-chart recorder is used, is a Z-fold or roll type of chart desired? Z-fold has become the primary choice for process applications because of the ease with which an operator can review past traces without disrupting active recording. |
| 16) |
Should the chart speed be fixed or programmable? |
| 17) |
What kinds of annotations on the chart are desired? Tags, lists, engineering units, messages, scales, channel identification (numeric or alphanumeric), date and time, chart speed, and instantaneous, "snapshot" values. Continuous writing instruments provide the annotation by a separate printhead. |
| 18) |
For a strip-chart recorder, what chart width is desired-100 mm, 180 mm, or 250 mm, other? |
| 19) |
What secondary visual indications are desired? Analog bar graph in percentage of full scale? Analog scale indication in percentage of full scale? Digital channel (point) number and measured value? Alarm status? Engineering units? |
| 20) |
What operating modes will be required? Options include normal monitoring, which involves monitoring at a set scan interval and trend recording at a set chart speed, or logging at set intervals; print on alarm, which involves monitoring at a set scan interval but not trend recording or logging until an alarm condition occurs; and change on alarm, which allows tending or logging at a base chart speed or log interval when no alarm condition exists and an automatic switch to an alternate (usually faster) chart speed or log interval when an alarm condition exists. |
Oscillographic Recorders
Used primarily for applications in the test and research fields, the capabilities of oscillographic recorders and the newer digital oscilloscopes have expanded greatly over the past several years. An oscillograph is a device for determining waveforms by plotting instantaneous values of a quantity such as voltage as a function of time. A decade ago, this implied either a recording galvanometer or a CRT recorder-analog instruments that afforded the needed bandwidths in excess of 20 kHz.
As in other recorder developments, however, digital is the buzzword today and digital storage oscilloscopes (DSOs) or simply digital oscilloscopes have proliferated. These may be defined as oscilloscopes that digitize an input signal for storage in memory for later display or analysis. It is a logical and relatively simple step to use the stored data to provide a chart record, and many DSOs do just that, essentially acting as data loggers.
A recent survey lists some 30 different suppliers of DSOs, many of them PC-based. They cover a range of bandwidths-some around 40 to 50 MHz while others go as high as 350 MHz. These are sophisticated electronic instruments that have capabilities far beyond traditional analog CRT-based oscilloscopes, which have been around for many decades.
Analog Oscilloscopes
An early form of oscillograph, also called a "light-beam recorder" uses a mirror connected to the rotating armature. An input voltage causes a degree of armature rotation which, in turn, moves the mirror a proportionate amount. A light source, usually ultraviolet, is reflected off the mirror onto a light-sensitive paper which moves at a fixed chart speed like a strip-chart recorder. The result is a series of light spots (data points) on the recording chart. Frequency response of this device is some 25,000 Hz.
A step in the advancement of recording analog oscilloscopes is the CRT-based instrument. These instruments can display not only instantaneous values of voltage vs. time, but using suitable input transducers, can convert other variables-such as current, strain, acceleration, and pressure-into voltage for display on a CRT.
The CRT display is a graphical representation of electrical signals produced by varying the position of a focused spot where an electron beam strikes the fluorescent (phosphor) coating on the inside surface of the CRT face. This type of oscilloscope over the years has benefited from advances in solid-state, semiconductor electronics, as well as improvements in phosphors which are also used today for CRTs in other applications. In fact, some CRT-based terminals and workstations are, in essence, highly-sophisticated oscilloscopes.
One typical fiber-optic DSO can be adapted to record over 30 channels. Records that are relatively insensitive to normal room light are produced by ultraviolet light generated by the CRT. The UV light is directed through a special CRT fiber-optic faceplate onto photosensitive direct print paper.
The CRT faceplate consists of millions of tiny glass fibers, fused together within a 5- by 200-mm (0.2 - by 8-inch) area. These fibers are the means for transfer of ultraviolet light from the phosphor inside the faceplate to the photosensitive recording paper-enhancing writing speed and trace resolution.
 |
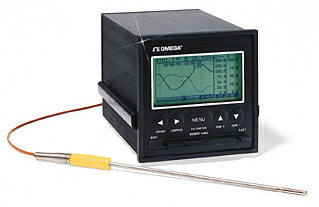
Videographic, or paperless recorders provide trend
indication without the maintenance requirements
of pen-and-paper systems. |
Note that the recorder has four axes: an X axis (time base or horizontal), Y axis (amplitude or vertical), Z axis (spot intensity), and Y axis (movement of recording medium). The four axes provide an instrument that is very versatile. For example, video pictures from television or facsimile can be recorded by use of the Z-X axes, together with either the Y or Y axis. The quality of the pictures will depend on such factors as sensitivity of the recording medium, bandwidth of the Z-axis amplifier, and the spot size that can be recorded.
Oscilloscope Selection
There are many technical details in oscillographic recorder or digital oscilloscope designs that can only be highlighted here. Some of the terms used in evaluating and selecting one type versus another are:
Bandwidth: In data communications, this term means the difference between the highest and lowest frequencies of a transmission channel. With oscilloscopes, it is expressed in MHz. One supplier defines bandwidth as the maximum frequency that a scope can capture without reducing the amplitude by more that 3 dB. Generally, the greater the bandwidth, the more waveform information can be sent through in a given time. With such increases, however, can come an increase in cost and complexity. DSOs can have a bandwidth as high as 500 MHz at a relatively low cost, whereas similar performance in an analog unit is not readily available.
Trigger Capability: Triggering the device means initiating the measuring function at appropriate times versus having the instrument running all the time. Flexibility of the device in triggering extends its ability to capture, for example, any aberrations that occur on a signal or group of signals.
Mode of Operation: An analog oscilloscope is best for displaying signals with high information content, such as video. This is due to its high real-time screen update characteristic. On the other hand, a storage oscilloscope may be better suited for transients, alphanumeric display, curve traces, etc.
Analog and Digital Storage:Several manufacturers offer oscilloscopes that combine both analog and digital storage in one unit. The display flexibility this affords is well suited to general purpose applications, from single use to complex signal handling.
Sampling Rate:In a DSO, this is the maximum speed at which the analog-to-digital converter samples the incoming waveform. It is usually specified in millions of samples per second (MS/s). The Nyquist theorem states that a signal must be sampled at least twice as fast as the highest frequency content of the signal, therefore the user must always be conscious of having enough sampling points to reconstruct the waveform accurately.
Memory Length: This is the number of samples that a DSO takes each time a waveform is captured.
Vertical Resolution: In a DSO this is the number of digitizing levels from the A/D converter; 8-bit resolution gives 256 steps and 12-bit resolution gives 4,096 steps.
Interface for Remote Control: Most DSOs have interfaces (IEEE-488 or RS-232C) that allow them to be remotely configured and controlled.
A basic characteristic of an analog scope is the variable intensity of the displayed trace. Changes in trace brightness and line width result from the fact that light emission from the CRT phosphor coating is proportional to the speed of the electron beam exciting it. Operators have learned to interpret and rely upon intensity variations to the extent that some manufacturers of combined analog and digital oscilloscopes recommend that the user switch to analog mode if there is any doubt about a waveform's true characteristics.
There are other reasons for using analog oscilloscopes, but DSOs offer three capabilities which lead to their preference in many applications. These include the ability to capture and display very slow signals, the conversion of signals into digital form for further analysis, and the ability to more easily handle higher bandwidths.
 |
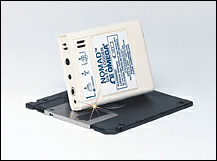
Extremely compact, battery-powered data loggers
can even ride along through a process for accurate
temperature and humidity profiling. |
In short, today's digital oscilloscopes are marvels of modern, state-of-the-art technology-offering test and research technicians and engineers extremely versatile tools.
|